
You are here: Home > News > 201-18 Brief introduction of porosity curve of fisher sub sieve sizer average particle size analyzer
201-18 Brief introduction of porosity curve of fisher sub sieve sizer average particle size analyzer
201-18 Brief introduction of porosity curve of fisher sub sieve sizer average particle size analyzer
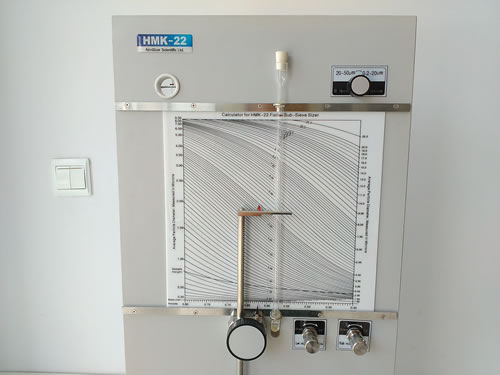
The porosity curve is plotted on the reading chart of the HMK-22 fisher sub sieve sizer average particle size analyzer. To be precise, this is not a porosity curve, but a curve that the sample height changes with porosity. When samples of different specific gravity are measured, there is a specific demand for the height of the sample, and the various heights form a curve.
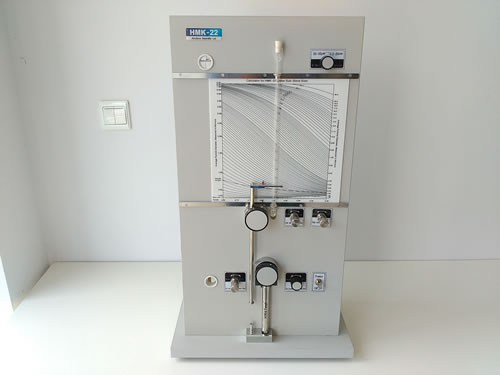
HMK-22 Fisher sub sieve sizer
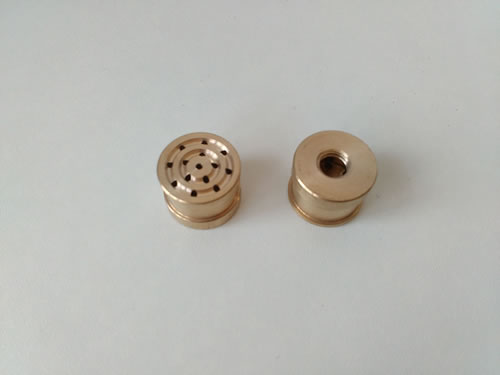
Fisher sub sieve sizer porous plugs
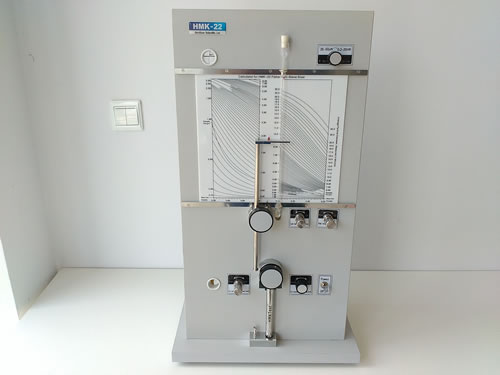
Fisher scientific sub sieve sizer
Fisher sub sieve sizer https://www.hmk-test.com